Why subscribe?
Gold Investor Research provides unique and in-depth analysis of the gold market based on data-driven research. The intention is to provide fellow investors with analysis to help them make informed decisions and set forecast expectations on the cyclical path of the gold price.
As a fellow investor, we know that time is money, and if this research is useful and saves you time from doing similar in-depth analysis, please consider subscribing. The subscription is modestly priced at $18/month and my intention is to deliver to you a value greater than that.
Weekly Updates are posted at the end of the week with Brief Updates posts during the week depending on events. Special Report articles are also posted on occasion that give a deeper dive into specific topics.
Unique Set of Analysis Tools
By viewing a topic from multiple perspectives, one can typically gain a richer understanding of it. For this reason, we utilize a unique and multi-pronged set of analysis tools in order to forecast the gold price and its cyclical movements. These tools include:
1) Long-Term Cycle Levels:
These fundamentals-based gold price cycle levels provide a convenient method to quickly see where the gold price is within the cycle over the short- medium- and long-term. Essentially, these levels correct for the effect of embedded monetary inflation in order to facilitate price comparisons over time.
See more at: An Alternative Perspective for Framing the Gold Price Based on Fundamentals.
2) Recurring Cycle Levels:
Normalizing the gold price to its mid-cycle level not only better highlights the long-term cyclical nature of the gold price, but also helps identify major recurring support/resistance bands that go back over 50 years. Zooming in on the shorter time scale can bring out even more of these levels.
See more at: An Alternative Perspective for Framing the Gold Price Based on Fundamentals.
By translating the recurring levels back into the price chart, potential future price-target zones can be identified.
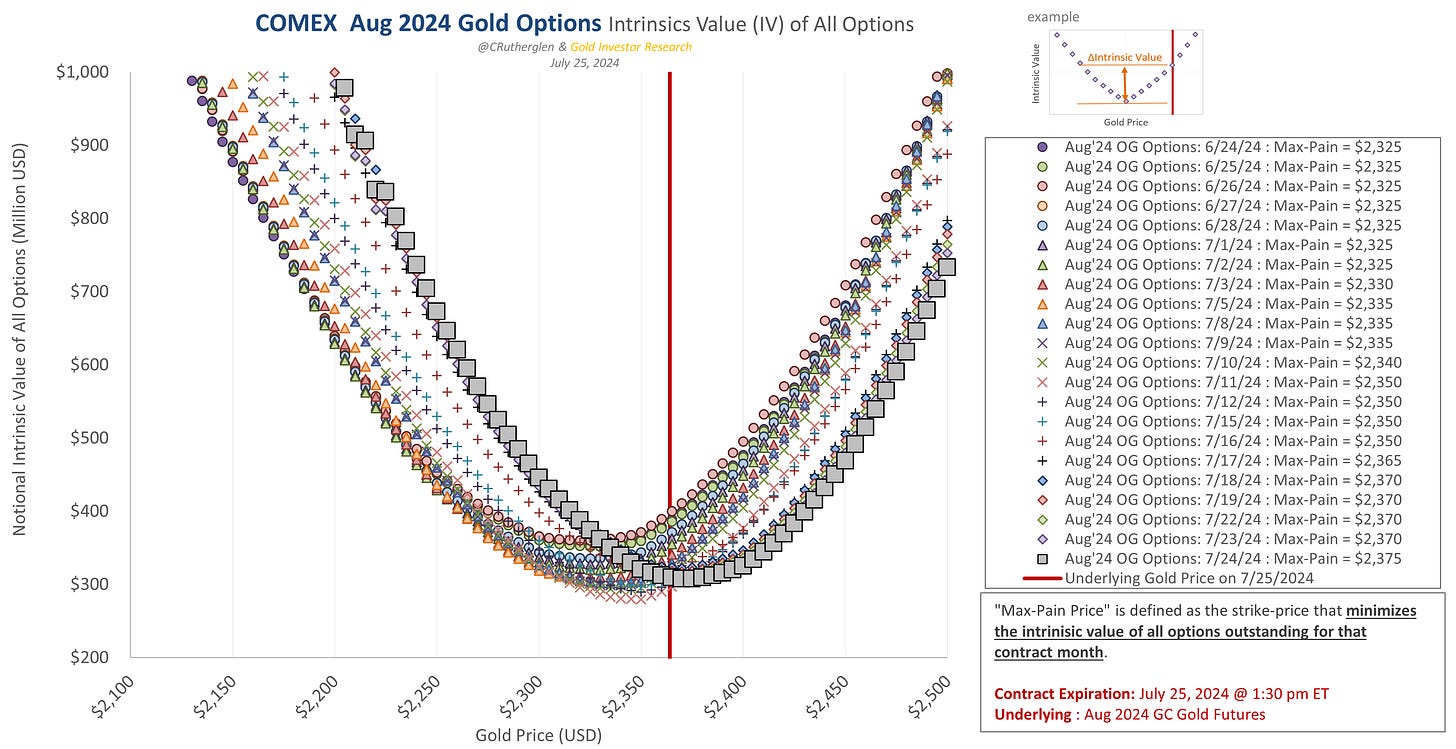
3) Gold Options & Intrinsic Value Curves:
Helping to drive the short-term cyclical nature of the gold price is the monthly gold options and their corresponding options expiration. As these opex dates approach, pressure on the gold price can manifest particularly if the underlying becomes widely divergent from what is implied from the option’s intrinsic value curves.
See more at: Gold Options: Intrinsic Value Curves (The Basics) and Gold Options Charts
4) Commitments of Traders
Weekly Commitments of Traders data give detailed long & short positioning data for each of the major trader categories. By normalizing their position levels to open-interest, historical upper and lower bounds can be identified and used help forecast near-term highs or lows when hit. Further information can be gained by monitoring for particular divergence that are common leading up to major cycle-highs.
See more at: COT Charts
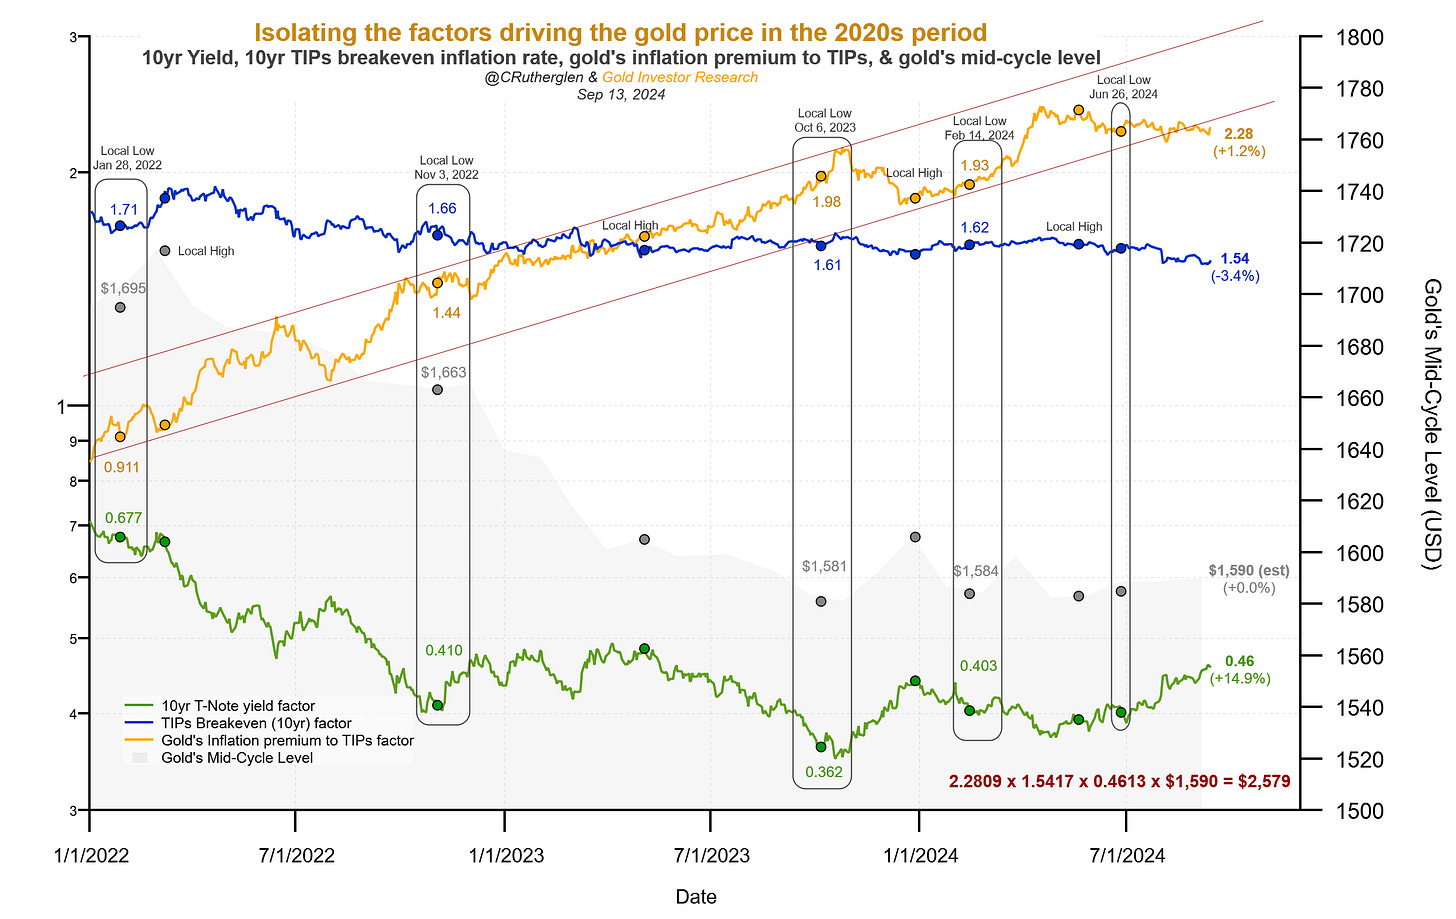
5) Driving Forces For Gold
Since the gold price is known to correlate well with long-term real yields, it is possible to re-express its price in terms of a yield and extract its four composite underlying factors. By doing so, we can identify what factor is driving the gold price at any given time.
See more at: Towards a comprehensive framework for understanding the gold price.
Equivalently, one can also re-express the gold price as a gold-based inflation expectation. During the 1970s, this value tracked the CPI inflation rate fairly well.
6) Fed Funds Rate Cycle
Since the gold price correlates well with real yields, it is not surprising that when yields fall, the gold price rises. The Fed Funds Rate cycle provides a simple timing tool for anticipating the gold price phase from i) consolidation, to ii) advance, to iii) decline.
See more at: Cycle Charts.
7) Intermediate Cycle
By cataloging all of gold’s intermediate cycle highs and lows since 2004, a map can be created to help set a band of expectations on when and what percent gains are likely for each phase of the gold price cycle: i) consolidation, ii) post-consolidation breakout advance, iii) mid-cycle advance, or iv) exit from a major cyclical low.
See more at: Cycle Charts.
8) Put:Call Volume Ratio
Local peaks and troughs in the gold’s put:call volume ratio is a helpful indicator to determine turning points in the gold price.
See more at: Daily Charts
9) M2 Money Supply
Since M2 money supply data is released with a one month lag, we monitor the main constituent factor of M2 in order to provide weekly updates on where it is heading.
See more at: Money & Inflation
Prior Calls at Major Cycle Highs, Lows & Breakouts
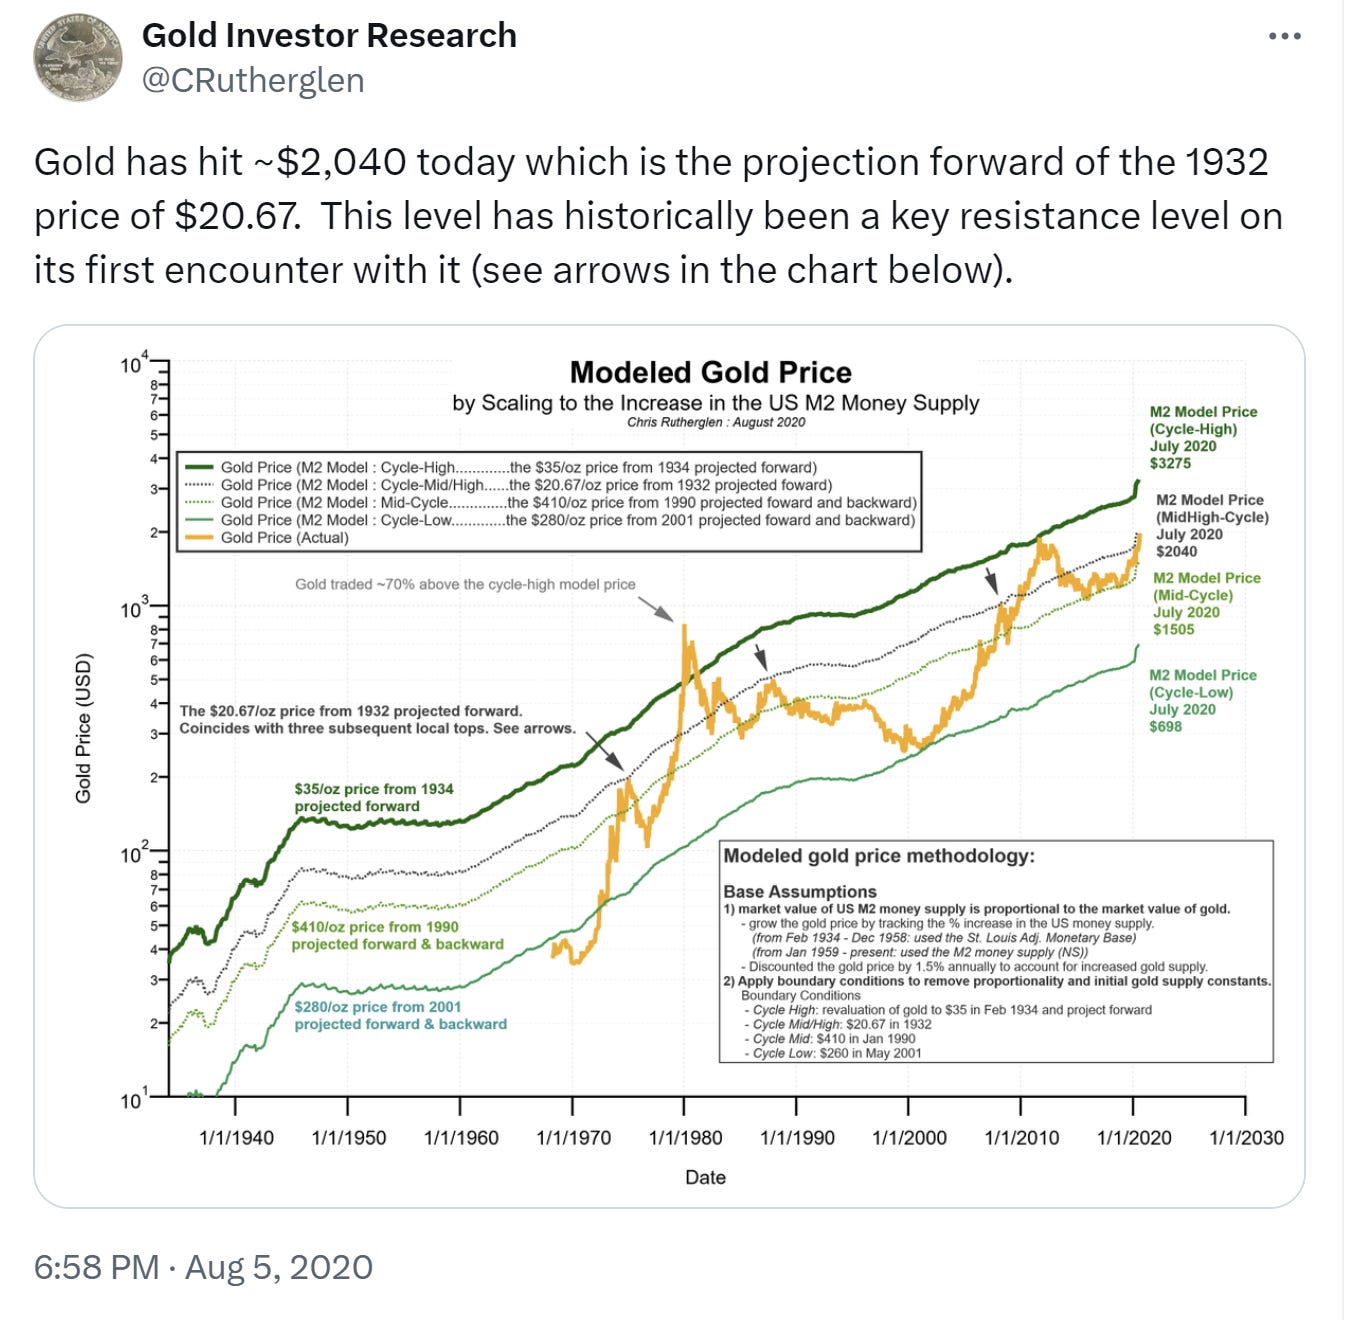
August 2020 High
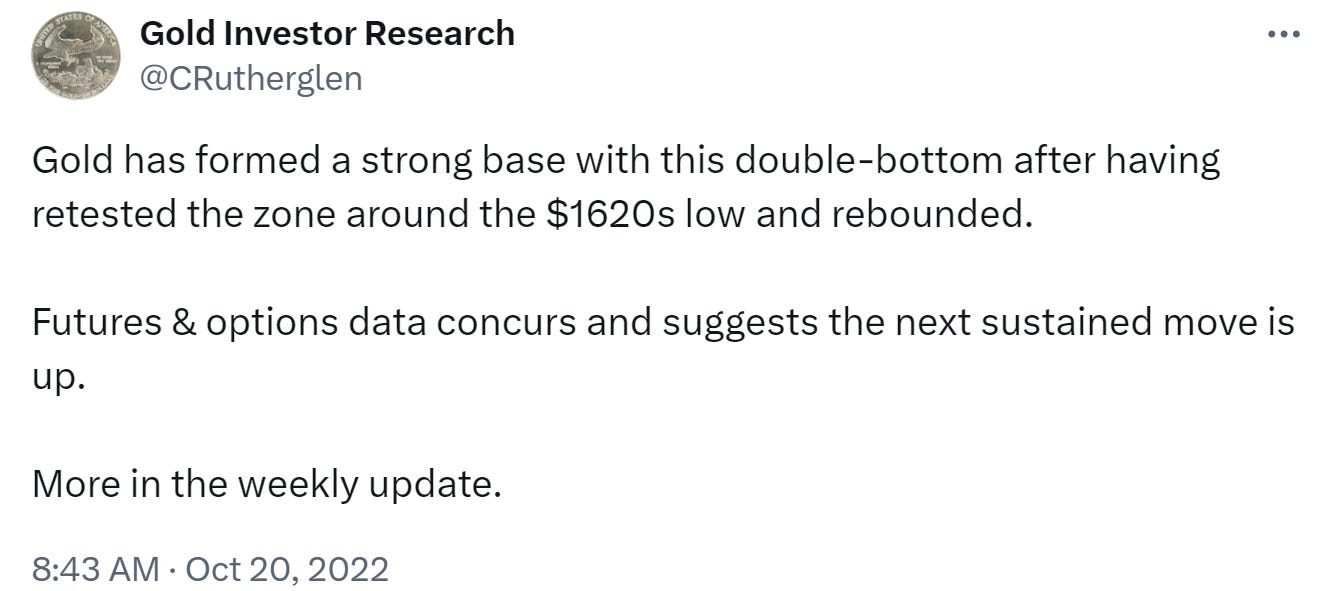
October-November 2022 Low
March 2024 Breakout
Disclaimer
By signing up or subscribing, you agree to the following terms:
This is an educational newsletter for providing supplemental analysis for precious metals and related investments. No content on the site constitutes or should be understood as constituting as investment advice or a recommendation to enter in any asset/securities transactions or to engage in any of the investment strategies presented in this newsletter. The author is expressing his opinions on any particular asset, not urging you to buy or sell an asset. The author is not a financial advisor nor is he responsible for any financial loss you may incur by acting on the information provided in this newsletter. Before making investment decisions talk to your financial advisor.
The author has done his best to ensure that the information provided in this newsletter is accurate and provides valuable information to the readers. The author shall not be held liable or responsible for any errors or omissions on this newsletter or for any damage you may suffer as a result of failing to seek competent financial advice from a professional who is familiar with your situation.
LIMITATION OF LIABILITY
You agree to absolve the author of any and all liability or loss that you or any person or entity associated with you may suffer or incur as a result of the use of the information contained on this website and/or the resources you may download from this website. You agree that the author shall not be liable to you for any type of damages, including direct, indirect, special, incidental, equitable, or consequential loss or damages for use of this website.
REDISTRIBUTION
Content published and made available to subscribers of Gold Investor Research is for personal use only and may not be reproduced or redistributed, in any form, without written consent from Gold Investor Research.


