The Fed Fund rate-cycle as a timing tool for the gold-cycle
A short-term interest rate context for anticipating gold's important highs and low
This is the third installment of a three-part series that examines what we can learn from historical interest rate cycles when they are viewed through the lens of the gold price. The first two parts:
examine the two major advancing-periods for the gold price (i.e. i. the 1970s and ii. the 2000s-to-present). In this post, we will summarize both periods by recasting the analysis from the perspective of the Fed Funds rate-cycle and using it as a timing tool.
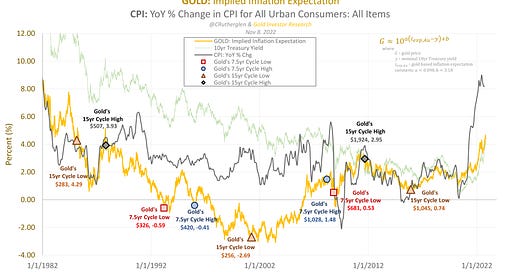
Continuing where we left off, by the early-2000s, the gold price had descended to its long-term cycle-low of $256 which implied a gold based inflation expectation of -2.7%. In comparison, the CPI inflation rate was range-bound between +2% to +4% at the time. Why the big disconnect? Originally it was though that this divergence was due to the proportionality constant ‘b’ (see inset equation in Figure 1) falling out of calibration. (One can read why the proportionality constant would need to be re-calibrated from time-to-time in a previous discussion here.) However, surprisingly, if one looks back to the early-1980s, the CPI (grey line in Figure 1) and the gold based inflation expectation (gold line) re-converge and roughly track each other. In other words, the same proportionality constant used currently seems to be valid as far back as the early-1980s. So the divergence seen in the late-1990s and early-2000s likely had more to do with gold just falling out of favor over that period as it declined to its long-term cycle low as shown here.
By the early 2000s, since the gold based inflation expectation and the CPI inflation rate had diverged by such a relatively large extent, the gold price had a lot of catching up to do. This is likely why during the 2004-to-2006 period, the gold price galloped higher by about +70% in the face of rising short-term interest rates (see Figure 2), a flat 10yr Treasury yield and disproportionate with the rising, but range-bound, CPI inflation rate, as shown in Figure 3.


