
Steve Hanke Interview & Inflation into 2023

Recently, Kitco’s David Lin interviewed Steve Hanke to discuss inflation and its causes.
In the interview, he suggests that the portion of money growth that exceeds the needs of underlying economy results inflation. Being curious, I got the data to see what it looks like. In Figure 1, the M2 money growth less real GDP growth is plotted along with CPI year-on-year inflation rate. One can see that historically, the M2 money growth in excess of real GDP leads the CPI inflation rate by 2 to 3 years. We can apply this to the 2020-2021 excess money impulse, which was the largest spike on the chart, to suggest that CPI inflation rate can be expected to remain elevated well into 2023 (i.e. 2021 +2 or +3yrs = 2023 to 2024).

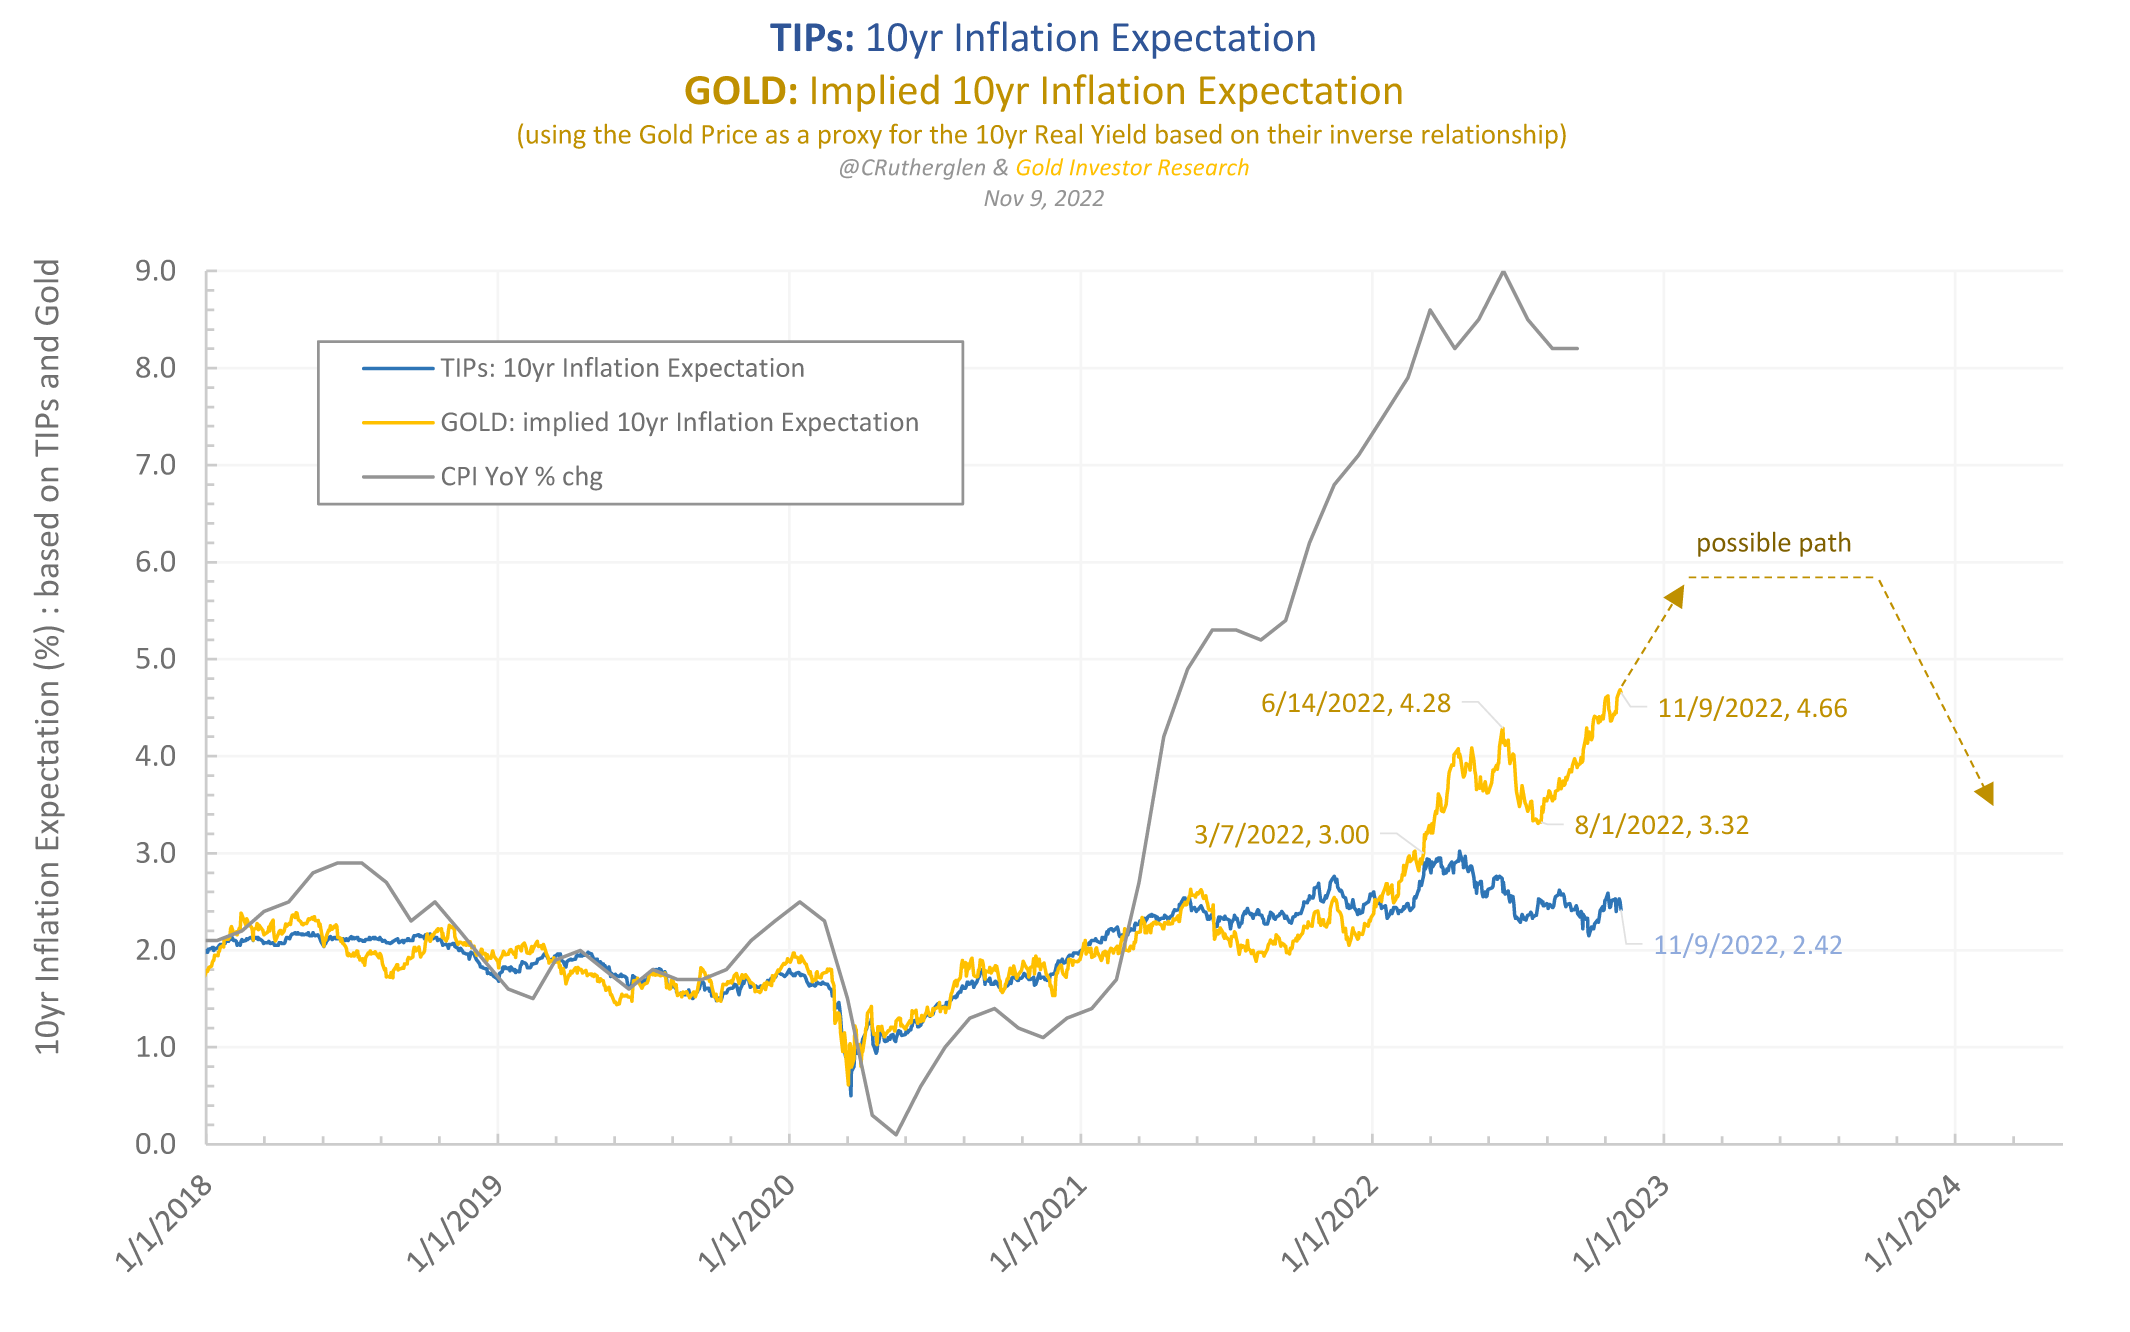
This ties in well with what we have been discussing in the prior posts having to do with inflation expectations continuing to rise into 2023 which will be a key driver for the gold price.
Another interesting interview/video on inflation: https://www.youtube.com/watch?v=_dvmHagBBvY&t=1s
Please find "Figure.2: All sample countries from 1920(318 observations)" by Deutsche Bank at this article.
https://www.gainesvillecoins.com/blog/is-gold-price-at-turning-point
==
Deutsche Bank analysts researched 318 episodes across developed and emerging markets since 1920 in which inflation reached 8%. The team concludes we have passed the point of no return:
Looking at this full history, the evidence shows that once inflation spikes above 8%, median inflation takes around 2 years to even fall beneath 6%, before settling around that level out to 5 years after the initial 8% shock.
==