


Weekly Update for Gold Investors : Oct 28, 2022

During the week, the gold price continued its basing action after putting in a double-bottom low on Oct 21 and is now trading around its mid-cycle level. Generally, the data continues to point towards a move higher which we will review below.

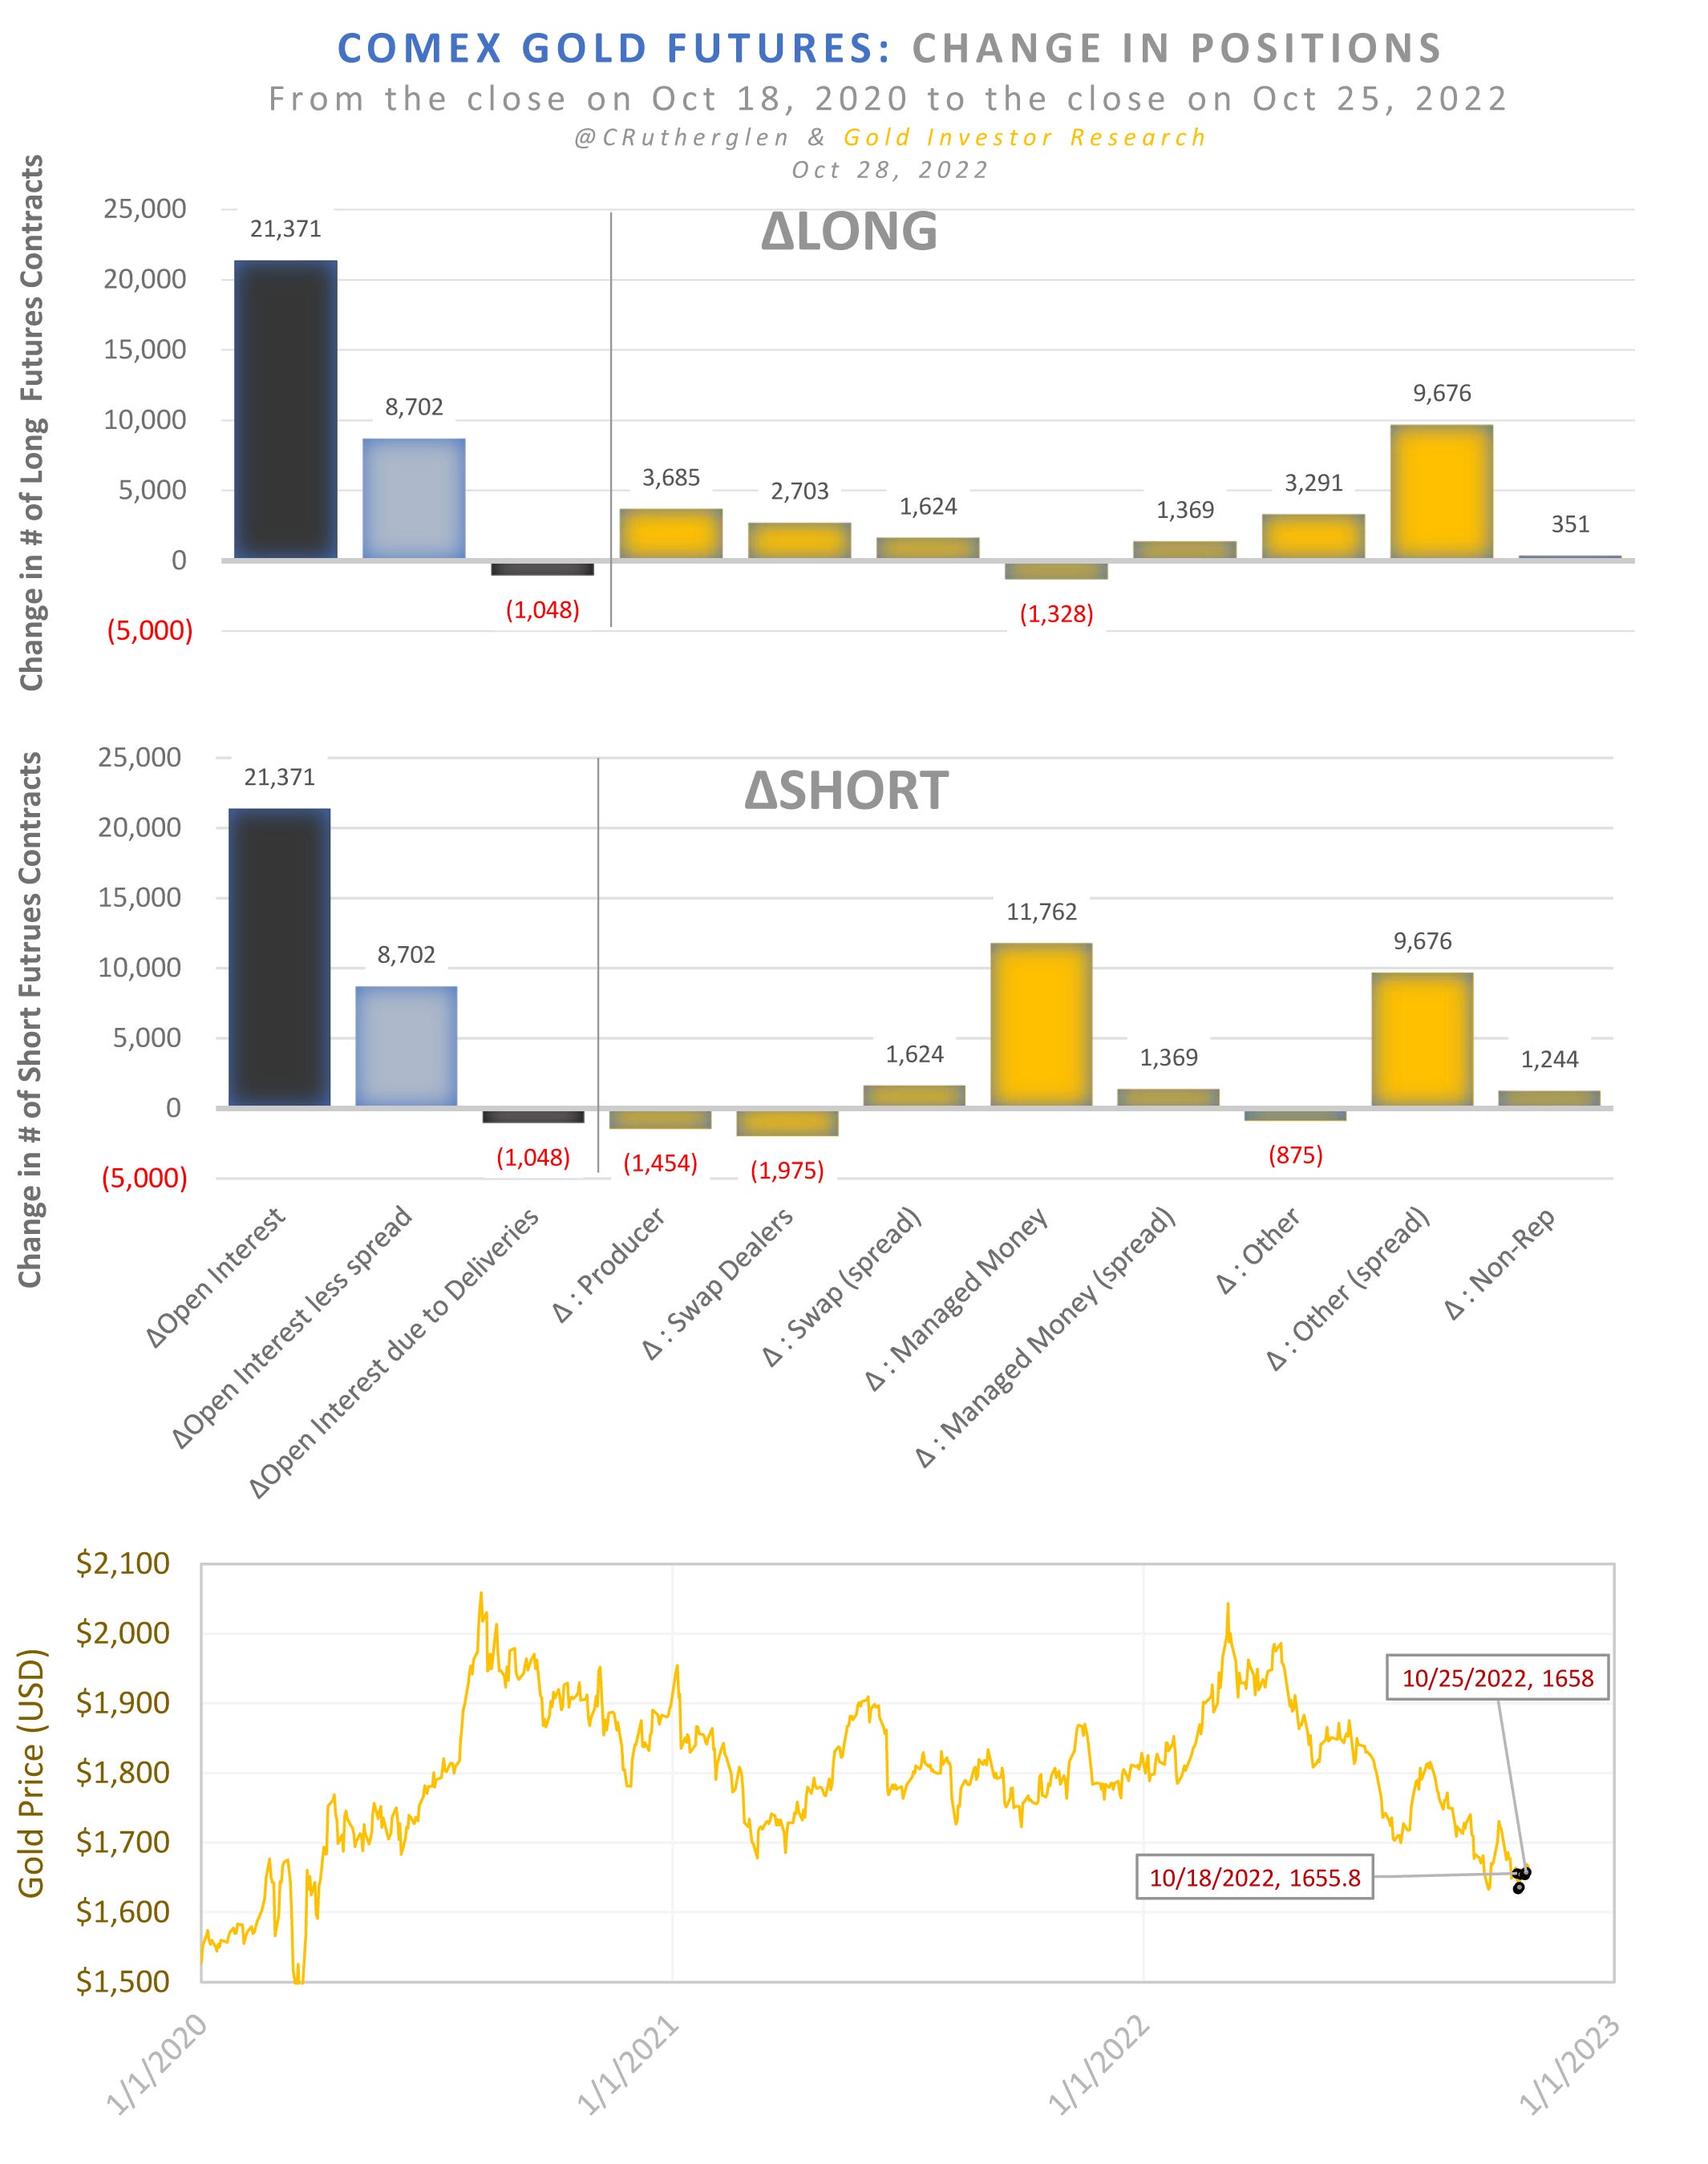
Gold Futures Open-Interest
Open-interest less spread positions, which correlates with the gold price, has turned upward for the first time since Apr 2022. Buying interest looks to be returning. In additional to the double-bottom low, this is another signal that the low is in and the next move is up.

Commitments of Traders Futures
During the COT reporting week from Oct 18 to Oct 25, which includes the double-bottom low on Oct 21, ‘managed money’ traders increased their short position and thus have yet to begin covering in aggregate.
Consequently, as of Tuesday Oct 25, ‘managed money’ traders were short 36% of open-interest and thus max-short going into this price-turn.

Some traders are covering though since the number who are maintaining short positions has dropped to 57 and well off the high of 71 traders during the late-Sept low.

Gold Options
Put-option volume for gold continues to decline mirroring the double-bottom analog from Mar 2021 as shown in Figure 6. This suggests that the trading activity into downside protection via put-options is waning as expected if the low is in.

Conversely, the volume activity to gain up-side exposure via gold call-options remains elevated.

And the ratio of the two, i.e. the put/call volume ratio, continues to decline.

Based on the $1,644 close for gold on Friday, the intrinsic value curves for the always large Dec gold options contract shows price is well outside of the high-probability range with a delta-IV of $136m. It is not uncommon for price to make wide excursions from the IV-minimum particularly when options-expiration is 17 trading day away. The reader can reference this previously posted historical chart (link) that capture prior instances of this. What it implies though is the underlying options ‘force’ on the gold price is ultimately up from the current $1644 level.

10yr US Treasury Yield
Last week on Oct 21, the 10yr US Treasury yield posted a local-high and has since turned down. This occurred 58 calendar days following the local-high in the TIPs 10yr inflation expectation which we have been referencing as a leading-indicator since it historically peaks one- to two-months prior to the nominal 10yr yield itself forming its own local-high.

This week saw continued strong money-flows into the iShares 20+ Year Treasury Bond ETF (TLT) as shares-outstanding increased by an additional 6% on the week or up 50% since mid-Jun 2022. Market participants here are positioning for an eventual fall in yields and are entering this long-duration asset in order to get leverage to such a move.

M2 Money Supply
On Tuesday, M2 money supply data for Sept was released and was directionally inline with expectations based on the month-on-month change in its major components. Looking forward to the Oct data, the major components suggest a near-zero month-on-month change with the money supply decline attributable to QT (or reduced bank reserves) more than offset by money exiting the FED’s reverse-repo program (RRP) which positively contributes to money supply. If this trend continues, there is over $2 trillion that could potentially exit the RRP and return to the money supply in a sort-of ‘stealth QE’.

Summary
Open-interest less spread positions has finally begun increasing which suggests buying interest is returning.
‘Managed money’ traders remain max-short into the COT Tuesday cutoff and thus have yet to begin covering their positions. When they do, that will help fuel a move higher in gold.
Put- and call-volume options data shows the activity is on gaining upside-exposure as opposed to downside-protection.
Gold options intrinsic-value curves shows that the current gold price is well below the high-probability range which suggest the underlying options ‘force’ on the gold price is ultimately up from the current $1644 level.
The 10yr yield put in a local-high last week inline with the timing expectation based on the 10yr inflation expectation.
Component data for October’ M2 money supply change shows funds exiting the FED’s RRP program was more than offsetting M2 money lost via FED’s QT or reserve contraction program.