


Primer for Gold Investors
Tools for understanding what drives the gold price and an outlook for the decade ahead

Section 1: Gold’s relationship with money supply
Viewing gold from the perspective of money is key to understanding its price. Starting with the basic assumption that the market value of the world’s investable gold supply is proportional to the market value of the USD money supply, one can get a simple scaling relationship for the gold price that accurately tracks the long-term trend in gold. All that is needed as inputs are the
M2 money supply growth rate
gold supply growth rate (assumed to be constant at 1.5% per annum)
historical gold price(s) from which to scale forward and backward from.
Details on the math are shown below:

Using this method, one can project forward and backward in time historical gold prices in order to map out the various cycle levels.
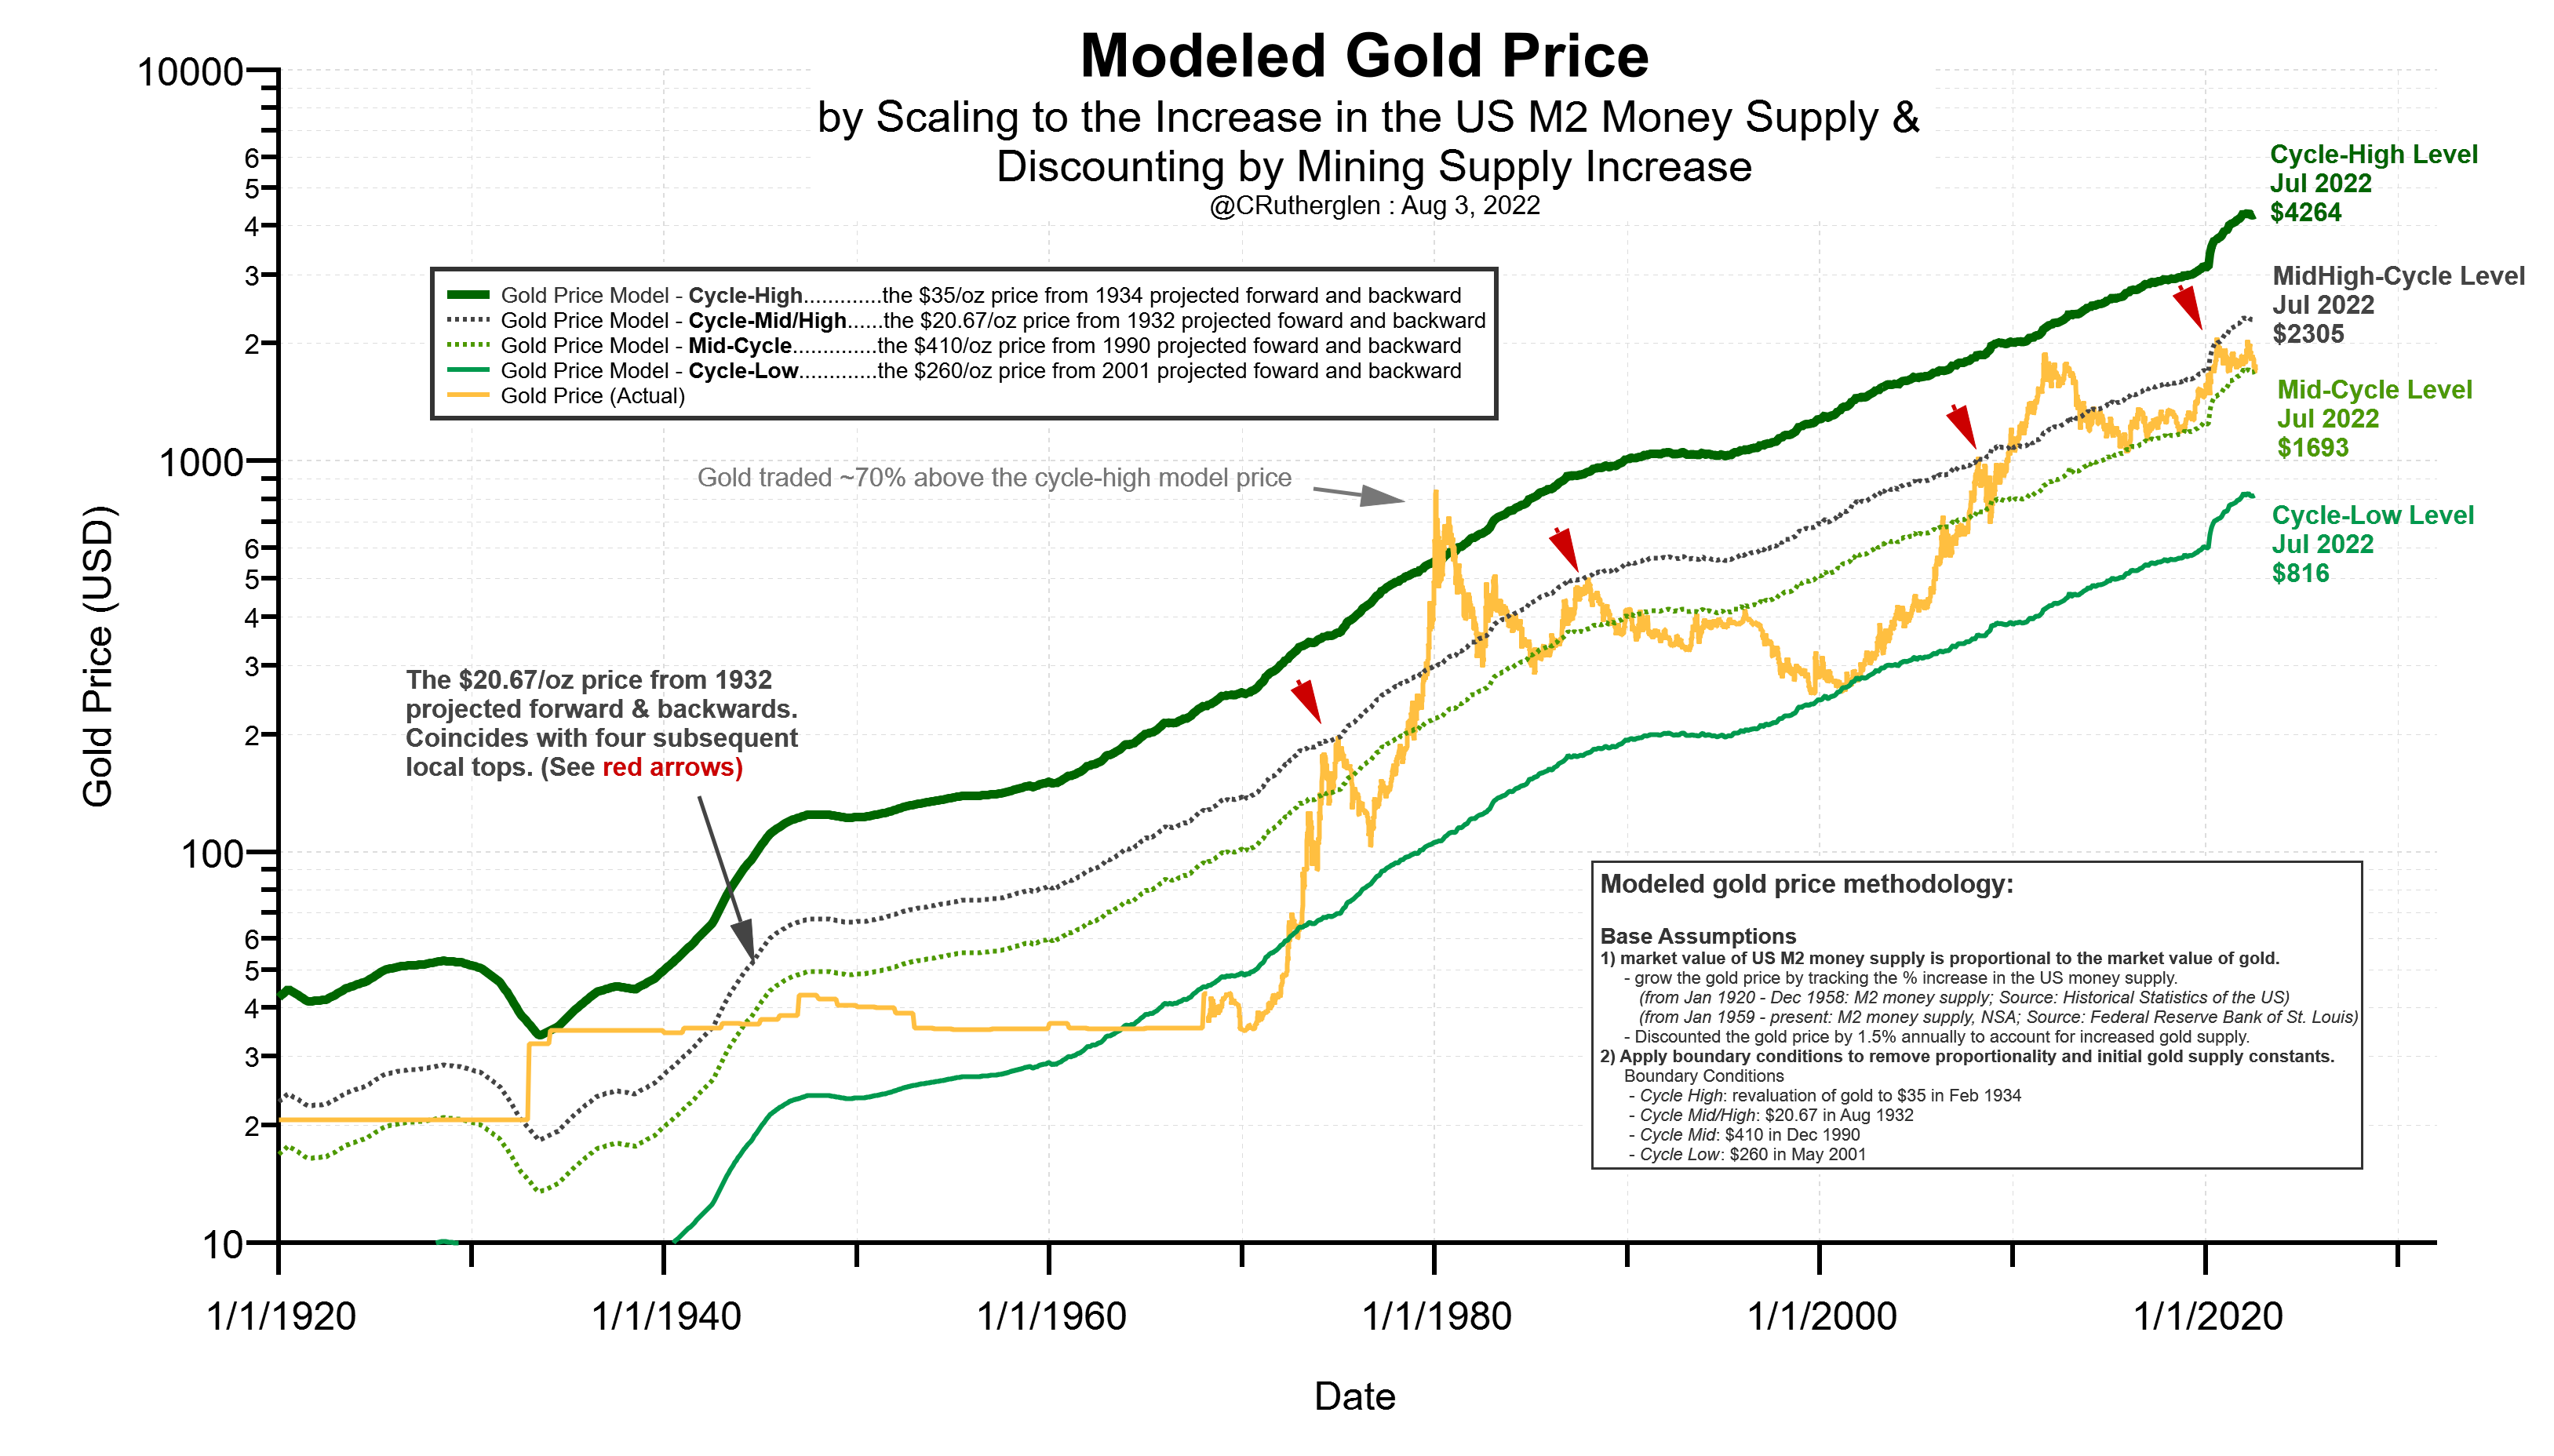
For example, the post-revaluation gold price from 1934 of $35 per oz can be used as one such starting point. In Figure 1.1, this is referred to as the cycle-high level since it only intersects the actual gold price near its long-term cycle highs; in 1934 and 1980. Other historical gold prices used in the chart are:
Cycle-Mid/High level: the gold price of $20.67/oz from 1932. This projects forward the price level just prior to its revaluation to $35/oz.
Mid-cycle level: the $410/oz price from 1990. This level was chosen because it is mid-way percentage-wise between the $873 high and $256 low. It is also mid-way temporally between the 1980 cycle-high and the 2001 cycle-low.
Cycle-Low level: the $260/oz price from 2001 was chosen since it was the recent major cyclical low.
These mapped cycle levels can then be used as benchmarks for determining where the current gold price is within the long-term cycle.
To exemplify how well this simple scaling function works, consider just the mid-cycle level compared to the actual gold price as shown in Figure 1.2.

From another perspective, by taking the ratio of the gold price divided by the mid-cycle level, as shown in Figure 1.3, one can see how the gold price oscillates around this level. Interestingly, price-swings about the mid-level have tended to be symmetric or of similar magnitude when comparing the down-swings with their subsequent up-swings.

Another interesting feature of the mid-cycle level is its historical tendency to function as support/resistance going back over 90 years. Staring in 1928-29, this level effectively functioned as ‘support’ as shown in Figure 1.3, and did so again in a truer sense in 1985-86.

Then, as shown in Figure 1.4 and identified by the red dots, the mid-cycle level became resistance to price in 1990, Aug 1993 and Feb 1996. During the current advancing phase of the gold price, the mid-cycle level has functioned again as support for the major Dec 2015 (15yr cycle low) followed by the Dec 2016, Aug 2018 and the recent Jul 2022 intermediate cycle lows.