


Low Complete. Gold to $2,200s by June.
Update for March 10, 2023

What a way to end the week!
Despite what the headlines may say, the gold price exploded higher due to the breakdown and precipitous fall in yields. Although its launch was timed just after the employment data-release, obviously it had no relation to it because the key non-farm payrolls data-point beat market expectations which otherwise would be considered bearish for gold as it would imply a continued aggressive rate-hiking stance from the FED.
In last night’s BRIEF UPDATE, it was noted that in after-hours trading, US Treasury yields had significantly broken down (meaning bond price were breaking higher). This should have been very bullish for the gold price yet it traded flat for much of the after-hours period, as highlighted by the shaded blue region in Figure 1. It wasn’t until a few hours leading up the non-farm payrolls release that the gold price began coiling just under an apparent $1,840 price-cap as it stored the ‘rocket fuel’ from the falling yields and then exploded higher moments after the release.

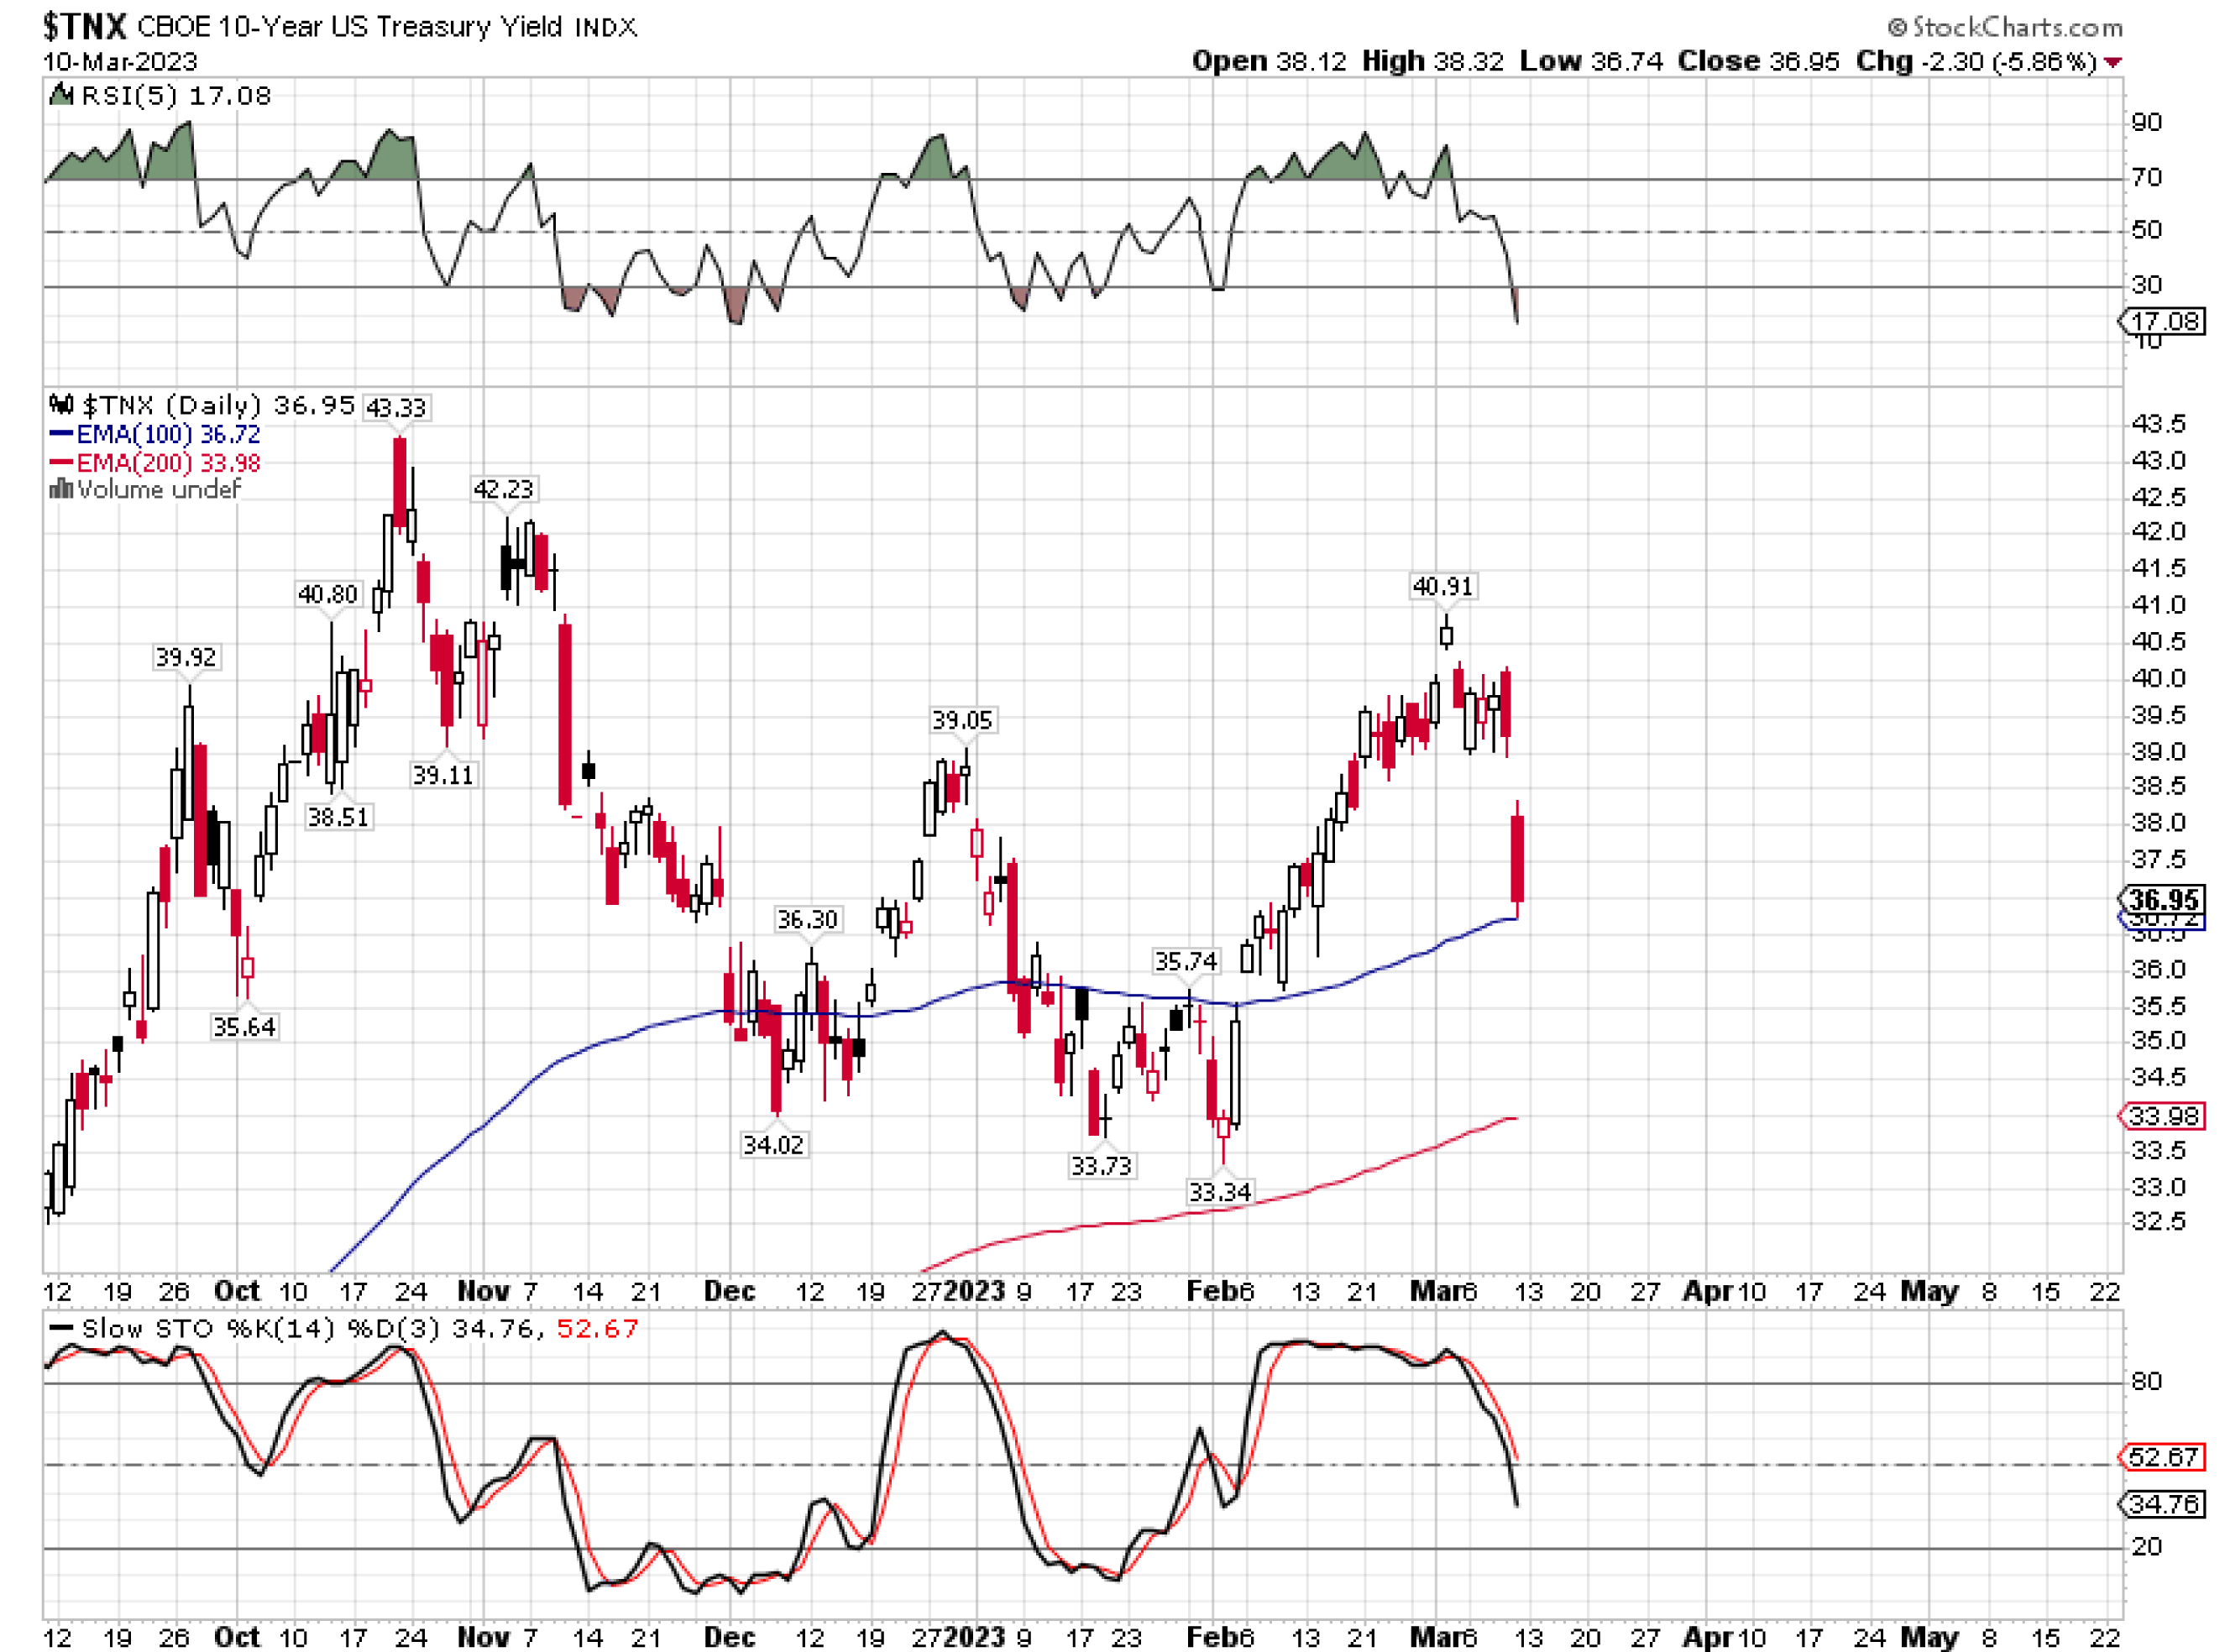
Presumably, gold market participants were reticent to be wrong footed by whatever the employment report may bring so they sideline themselves in the face of an big move in yields. Falling yields are generally good for gold and an epic fall in yields (Figure 2) is just rocket-fuel for the gold price.
In fact, 10yr yield dropped by so much that the gold price could not keep up and the difference was absorbed as a 15bp drop in the gold based inflation expectation. This translates to a marginal $60 to the gold price. In other words, had the gold price kept pace with yields and gold based inflation expectations had remained steady (as they had for the prior three days), the gold price would have closed on Friday around $1,928 as opposed to $1,867. This goes to show the convexity one can get in the gold market due to the exponential function.
Decomposing the closing gold price on Friday into its 10yr yield and inflation expectation components shows that it finished just below the 4.7% inflation expectation support level in Figure 3 or equivalently, just outside of the black-square in Table 1 (see red $1,874). Since markets are likely to remain in disequilibrium until after the CPI data release on Tuesday, we will give it a few days to settle before we reassess. But as of now, we continue to assume that the gold based inflation expectation will continue rising into the rising wedge pattern towards the mid-June apex (Figure 3).