

Gold Investors Weekly Update: April 9, 2023
Gold Investors Weekly Update: April 9, 2023

In this post, we review the topics,
Gold breaks out from its bullish ascending triangle
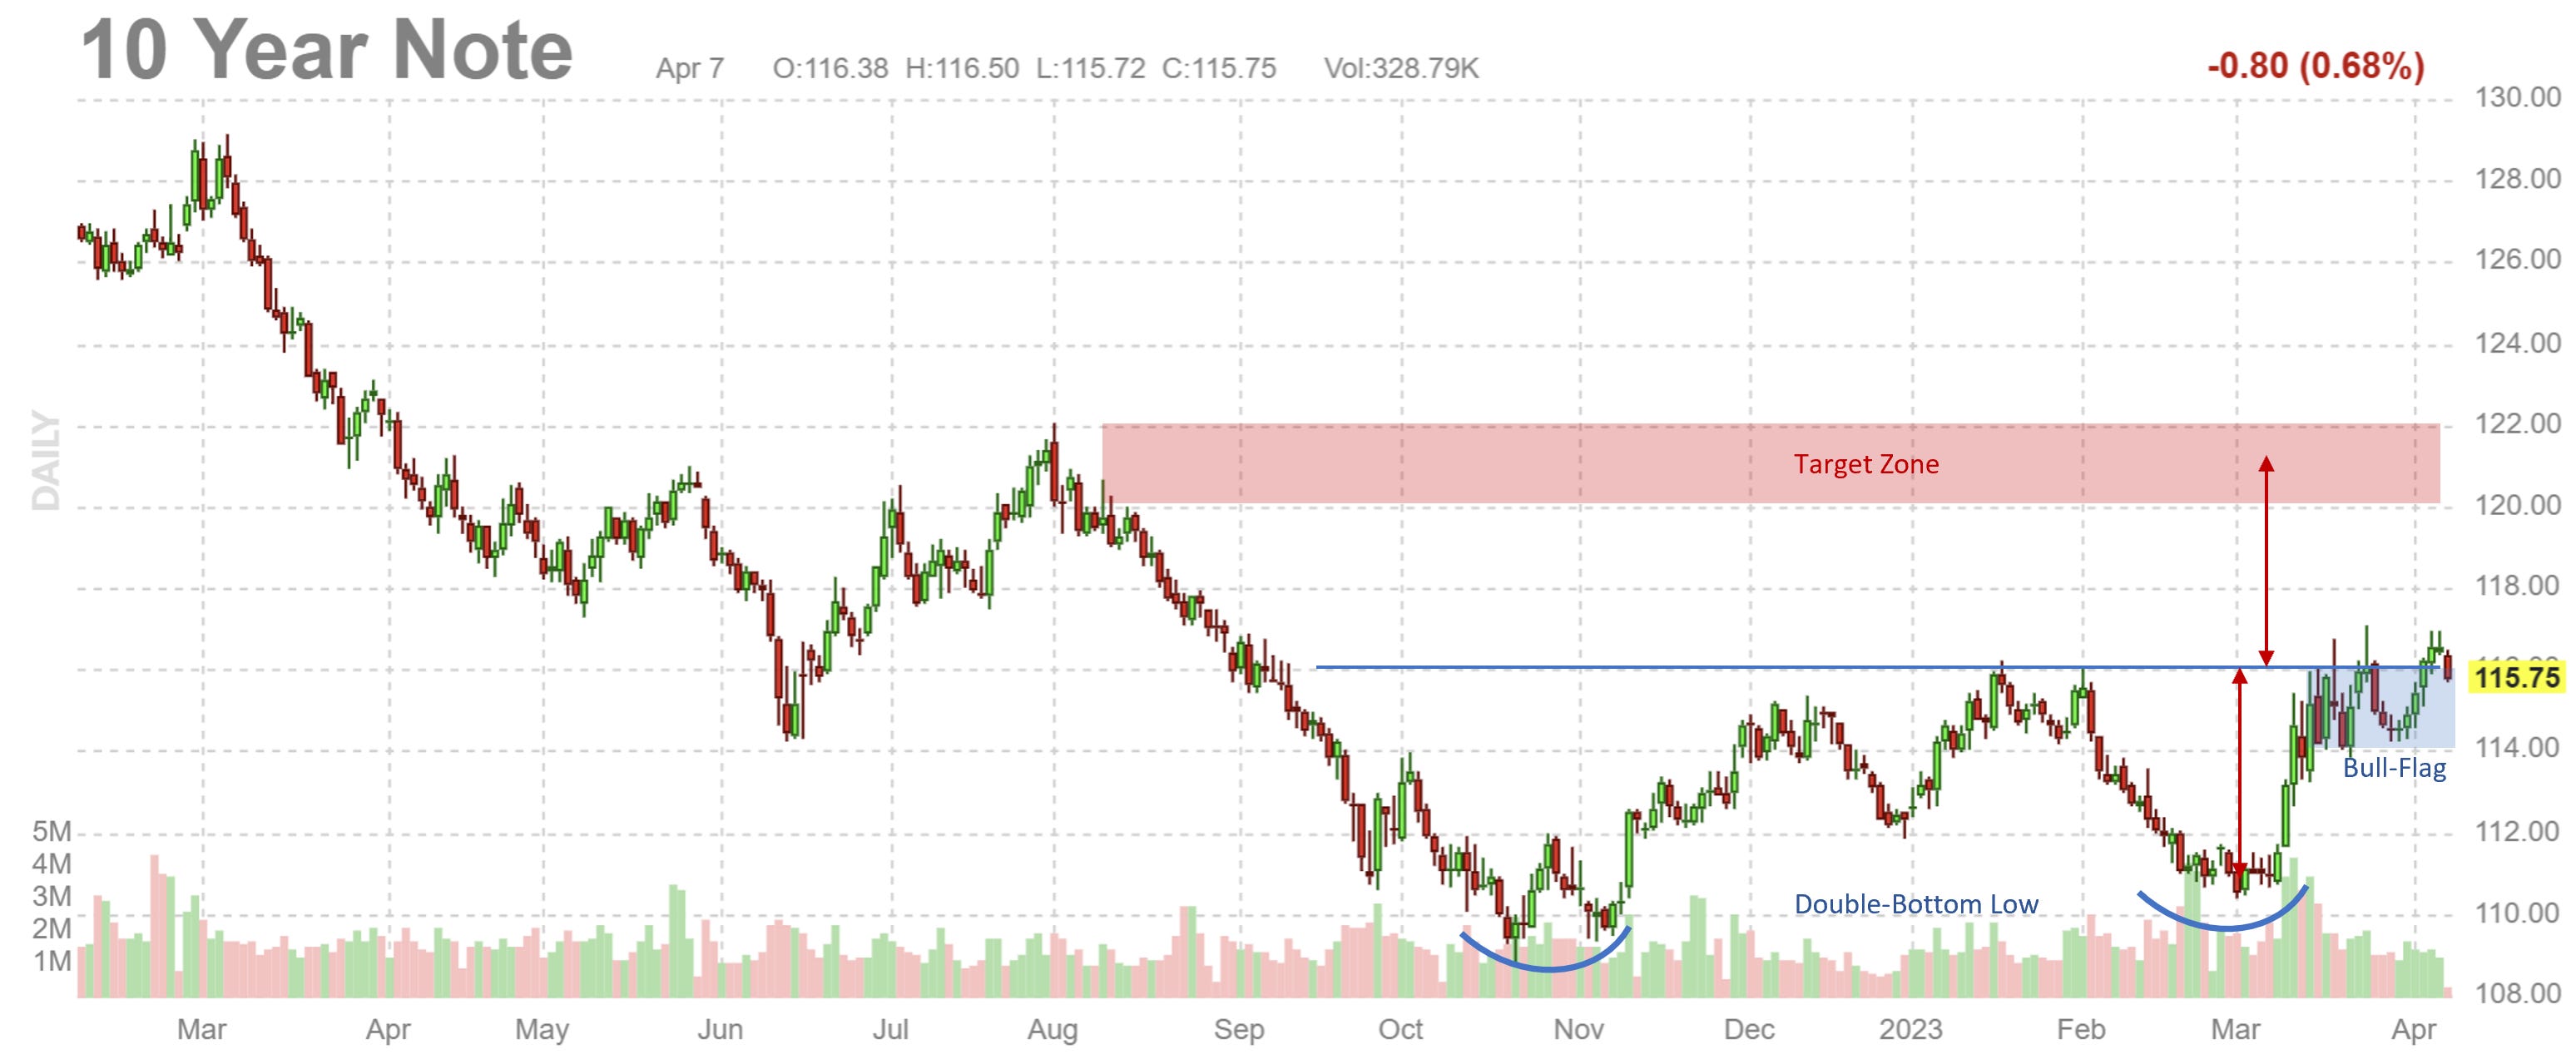
10yr Treasury Note teasing a breakout
Updated price-range targets expected for this intermediate cycle. Two price bands stand out: $2,200s or $2,400s.
Managed money traders drop short leg of large spread position and go long with the balance
May’23 gold option curves continue shifting higher
Updated HUI analog chart
Another strong week for the gold price as it broke out from its ascending triangle pattern on Wednesday and ultimately pushed up to $2,049 before backing off a bit at the close of the week. This breakout for gold coincided with the 10yr T-Note price also breaking above its 116 resistance level. Price then fell back below the 116 breakout level during afterhours trading going into the Good Friday holiday. Once normal trading resumes we can better determine if this dip below 116 was simply motivated by running stops during low-volume trading or a sign that more consolidation is needed.

Picking up from last weeks discussion, we continue to monitor the movements of the gold-based inflation expectation to better understand its trend and pattern in order to help set gold price expectations. A more detailed Figure 3 has been added to show its movements which for the past month have been bound within a triangle pattern with a base around 4.6% while being constrained on the top-side by the rising wedge pattern.
On Wednesday, April 12, the March 2023 CPI inflation numbers will be released which will add a new data-point to the more comprehensive chart on inflation and inflation expectations.